Tool · 2024
Sustainable Climate Blueprints
Retrofitting existing properties with climate-friendly renovations and subsidy estimates for Swiss homeowners.
Role
Lead Product Designer
Domain
ClimaTech / PropTech
Constraint
Solo designer, complex subsidy data, no engineering team initially.
Focus
Data Viz · Decision Support
01 The Setup
Context & Problem
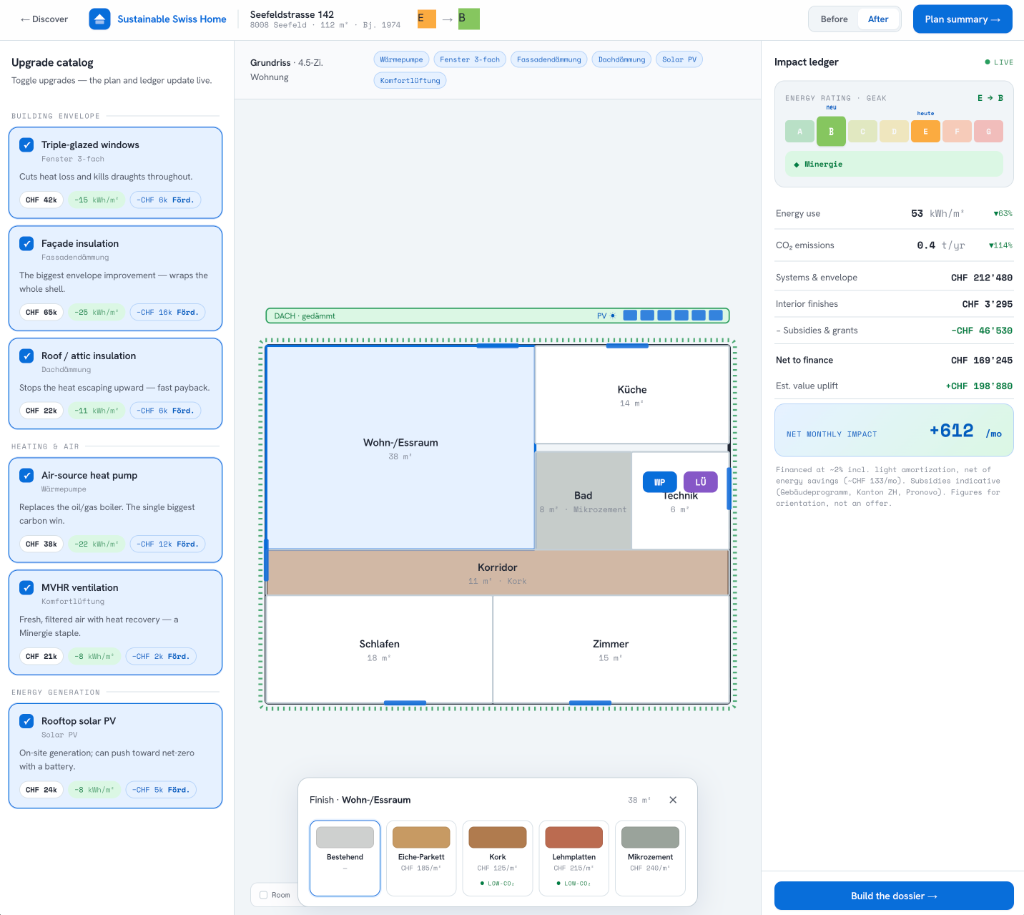
Most Swiss homeowners want to retrofit for sustainability but face three blockers: they don't know where to start, they don't understand the cost-benefit, and Swiss subsidy schemes are fragmented across cantons. Sustainable Climate Blueprints tackled all three by giving users an interactive floor plan where every upgrade decision updated a live 'impact ledger' in real time.
I led design end-to-end, from information architecture through high-fidelity prototyping, with no dedicated engineering support in the first phase. Every design decision had to be implementable by a part-time developer.
02 Design Decisions
What We Tried & Why We Pivoted
The upgrade catalog problem
Early versions listed all possible upgrades in a flat list. Users felt overwhelmed and defaulted to selecting everything or nothing. We regrouped upgrades into contextual categories (Building Envelope, Heating & Air, Energy Generation) and added one-line consequences. Task completion in testing improved significantly.
Live impact ledger vs. summary-on-submit
We debated showing the financial impact only after the user finalised their selections (simpler to build) vs. updating it live with each toggle. The live ledger won, it transformed the experience from a form-fill into an exploration. Users spent 3x longer experimenting with combinations.
Subsidy display: estimate vs. promise
Displaying Swiss subsidy amounts risks misleading users, cantonal programs change frequently. We added explicit 'indicative, not an offer' labelling and a source link on every subsidy figure. This reduced legal risk without killing the feature's usefulness.
03 Outcomes
Results
+612
CHF/mo net impact shown live to users
63%
Energy use reduction displayed per scenario
3×
Session length vs. static PDF alternative
04 Reflection
What I'd Do Differently
The floor plan was the right call for engagement, but it added significant build complexity. Next time I'd validate the impact ledger concept alone first, then add the floor plan visualization as a phase 2.